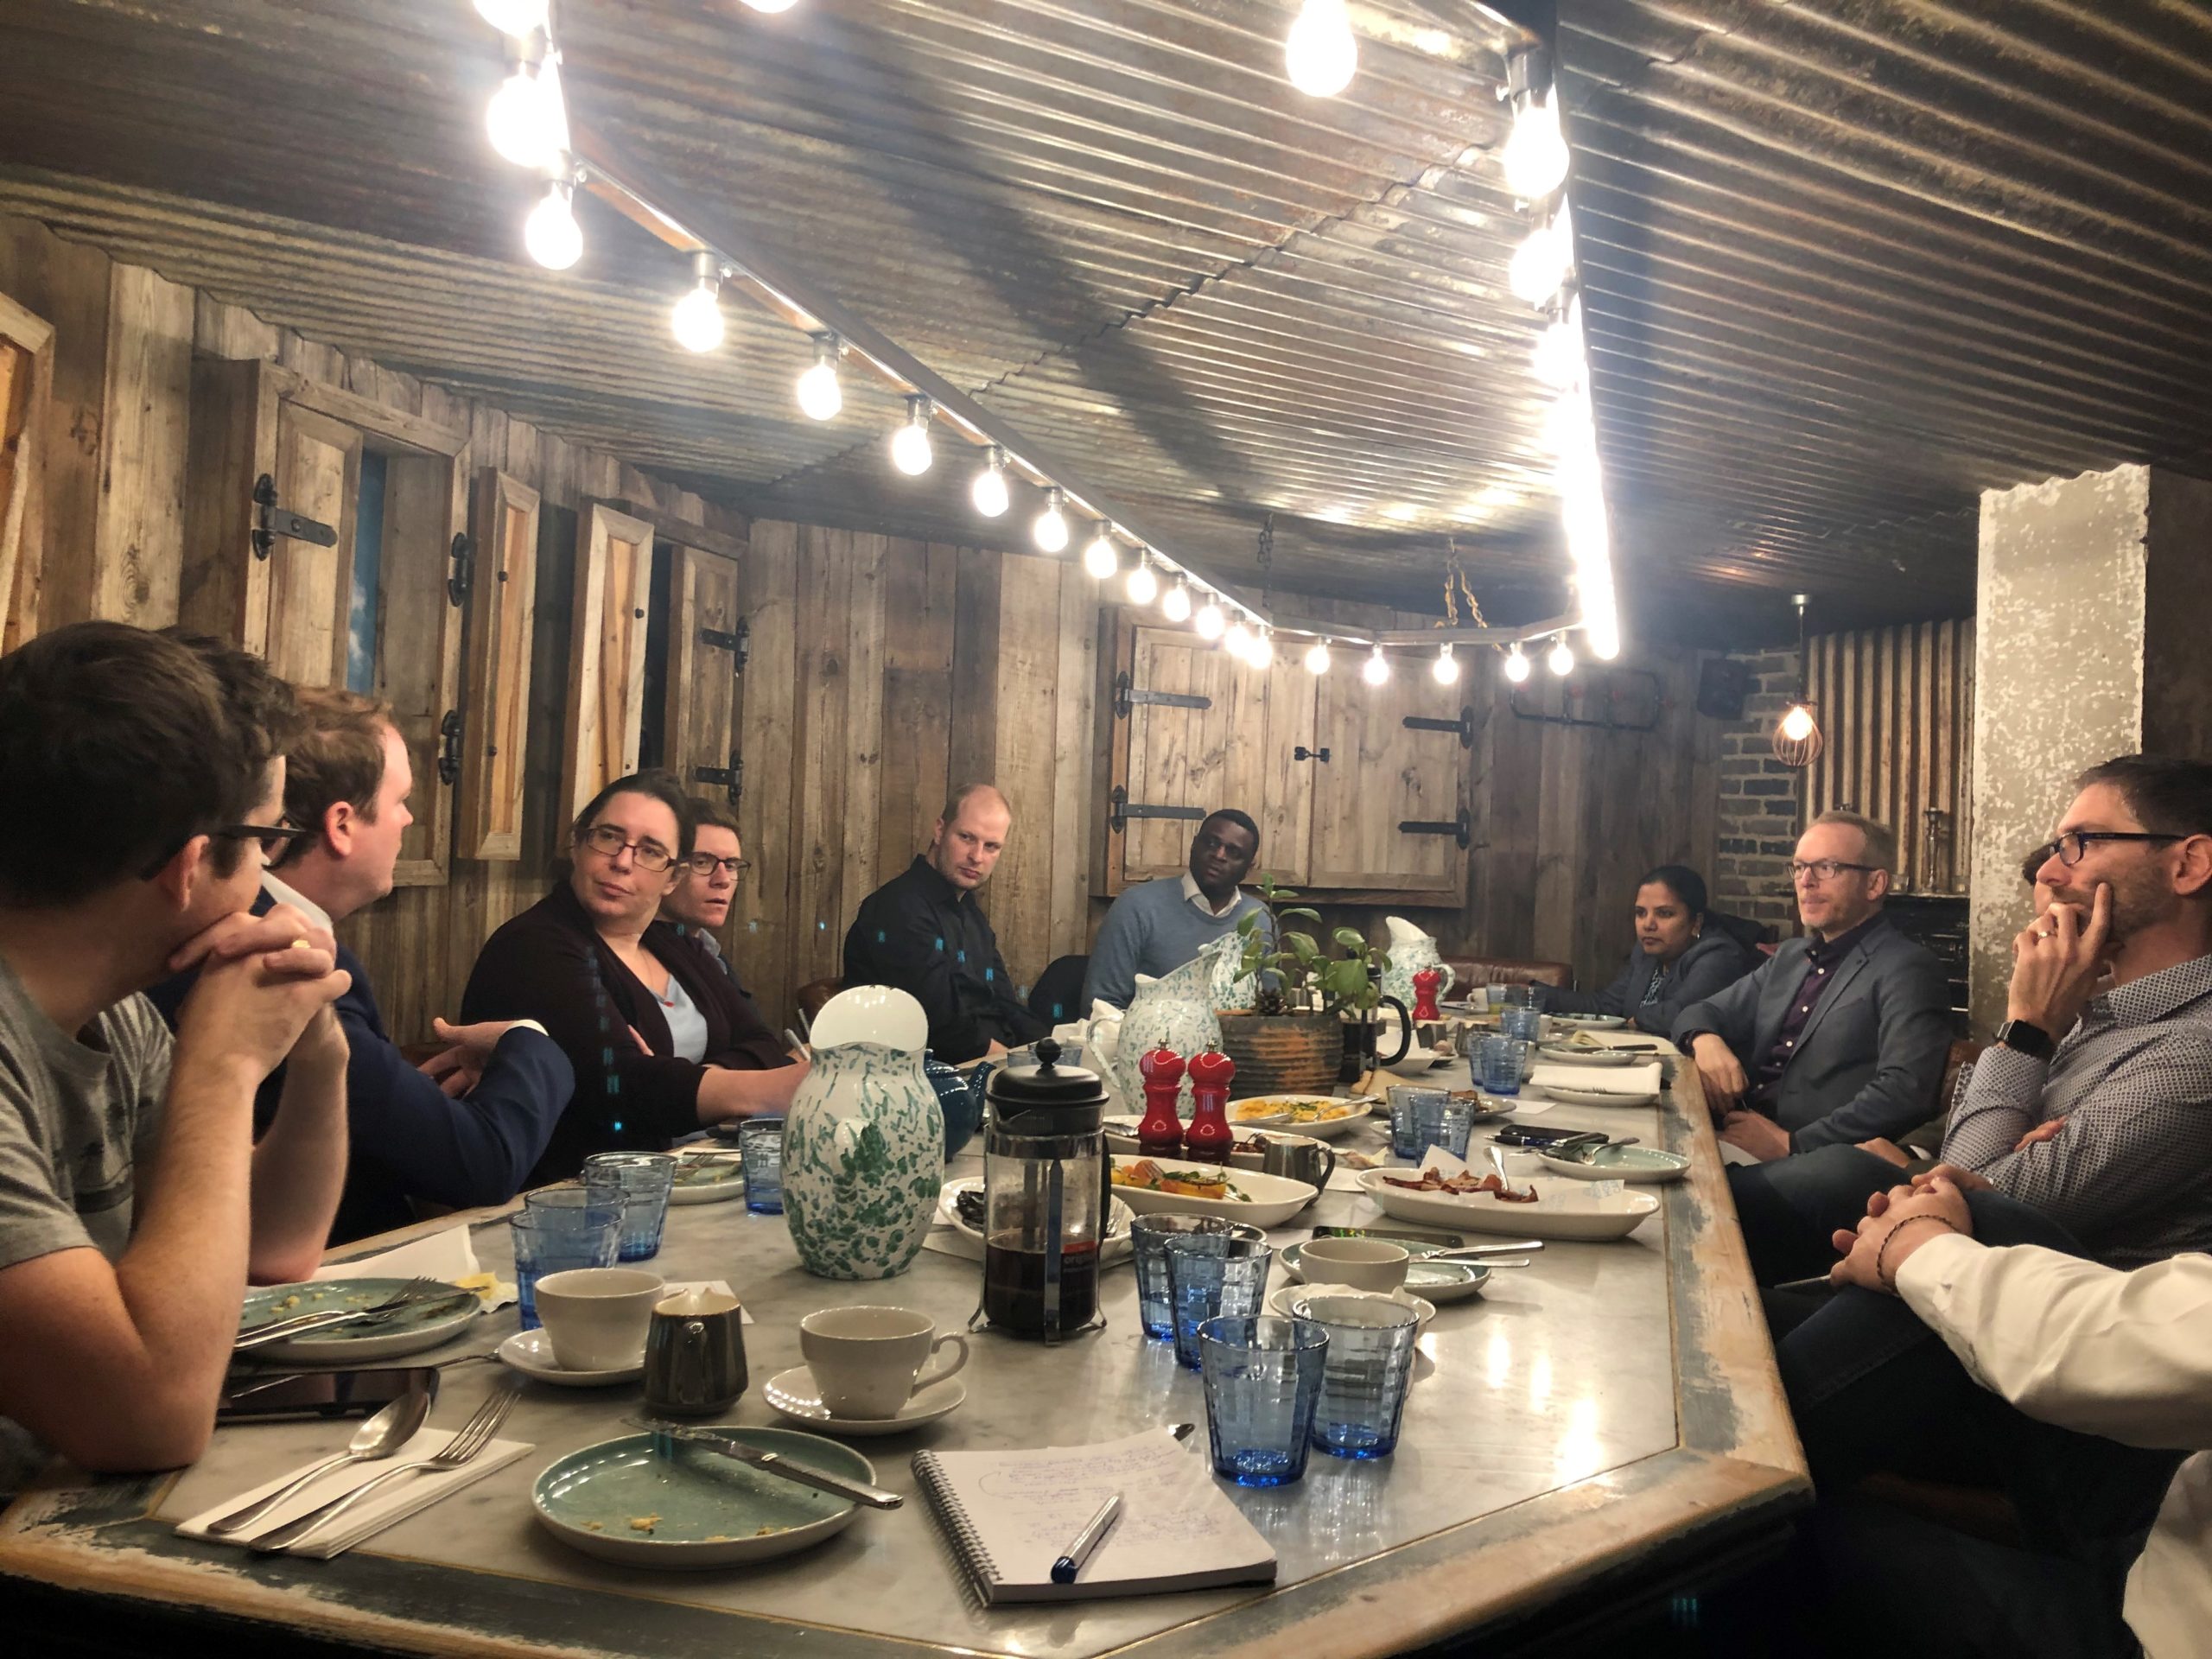
Ahh wake up & smell the coffee. And data. And pancakes.
Ok so we were back round the table talking all things data. Our roundtable breakfast debates bring together leaders across industry to discuss the subjects that matter most to them.
Guestlist for the event:
Hosts: Keith Robinson, Phil Marks, Co-Founders, AmmoniteData
Chair: Janet Bastiman, Chief Science Officer, StoryStream
Marcin Lisowski – Head of Data Analysis, LKQ Corp.
Ben White – Operations Insights manager (Data Science manager), TalkTalk
Julian Elliott – CDO Consultant. Ex- Dentsu Ageis, Direct Line,
Crispin Proctor – Solutions Development and ePOS Manager, Harrods.
Abim Tayo – Group Head of Data & Software Engineering, Helios Towers
Andy Isaacs – Head of Data Analytics, UKTV
Matt Whiteley – Head of Analytics, Mobkoi
Litha Hari – Head of Data Science, BlueOptima
Ian Newman – VP – Data Analytics Manager, Global Transaction Banking, Bank of America.
Our two topics for discussion:
- How to budget for Data Science – capacity, affordability, opportunity.
- Where does BI end & AI start?
These were the top 5 take-aways from the discussion:
- 70/20/10
One solution to managing budgets for data science is to employ the 70/20/10 model. 70% of resources/time is spent on BAU, 20% early stage exploratory on projects, 10% on ‘interesting sh*t’ to paraphrase. This way resources are being covered across the spectrum of needs in a sustainable way. You can also over estimate on BAU work to fit in more interesting projects incognito. Key outcome for deploying either of these tactics is to retain staff & keep the team motivated. If they are bogged down in BAU constantly, then heads will be turned by the promise of working on the latest & greatest elsewhere.
- Steal, pillage, delegate.
Ok, maybe that’s a bit strong. But the point is that there are often underutilised skills across the business that can be borrowed, upskilled & transferred into the data team thereby increasing capacity. For example, Excel wizards sitting in the finance department can be upskilled & (part) seconded into the data to be a useful resource in doing perhaps lower end tasks which will free up time for the team to work on more interesting projects. Alternatively, the lower end tasks can be delegated to other staff in the business with strong excel skills. Either way, leveraging resources in the business who just require some reasonably simple training to be effective is a great way to increase capacity when budgets are tight.
- Pictures paint a thousand words.
Keep it visual. Keep it colourful. Keep it pretty. Getting early buy in from non-technical stakeholders is often the most difficult part of the process. Once value has been demonstrated then the conversation becomes easier. However, during this process it is crucial that the pitch is kept very visual, with interesting graphs & colourful dashboards which non-technical stakeholders will implicitly attach meaning too & will naturally gravitate towards. Even though you, the data leader, will know it’s not the most exciting piece of DS, that is not the point at this stage. This is the ‘sales’ part of the process to get the ‘business’ onboard & to free up budget to take this further.
- Keep the frame about value, not cost.
Managing the frame is always important in any communication, but when discussing budgets for data programmes this can be key. A good strategy to deploy is to keep the frame around value rather than cost. For example, when comparing the value added through a data analyst vs per footage of retail space, it will be easier to build the case that the analyst is a good investment. Rather than the conversation turning into comparison between the cost of hiring data scientists vs graduate software engineers working in the platform team, where you’ll always be fighting an uphill battle.
- Seeing through the froth.
‘We’re in the bitcoin scam phrase of this’. The over promising & under delivering from data platforms is not a new story, so we need to see through the froth of the latest BI tools promises. However, beyond that it is clear that they are becoming powerful tools & increasingly more useful. A good example would be anomaly detection in the data. This is traditionally an issue in any data set that can take time & resources to get right, but these tools are very good at spotting those kinds of issue in the data.
- Combination of skills needed with augmented analytics.
As BI tools continue to mature, the line between where these end and AI tools start is becoming more blurred and the budgeting for data programmes will evolve. With further democratisation related skills across the business can be more effectively utilised, end users can access & interpret the data effectively plus less resource is needed for the lower end tasks as automation increases. In theory, this will free up budgets and time for the more complex work that requires more specialist ML / data science skills. Therefore, the overall output of a data team should increase without the necessity to vastly increase headcount. Budgeting should become more streamlined with results focused investment in specific use cases in each business.
However, this will only be effective if a senior data leader at Board level is managing the strategy and dynamics to ensure a successful implementation across the organisation. Data must be seen as a key strategic asset at the top table in the business and not as a siloed part of IT that can be solved through a software buying exercise.
A big thank you to all that attended & to our venue Riding House Café. The pancakes never fail to impress.
Be part of the conversation, get in touch below to enquire about attending our upcoming events.

